


|
|
|
|
|
|
METEOROLOGY INSTRUMENTS - The Lightning Detector & Weather Radar
|
|
|
|
||
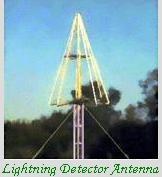
A Lightning Detector is a device that detects lightning produced by thunderstorms. There are three primary types of detectors: ground-based systems using multiple antennas, mobile systems using a direction and a sense antenna in the same location (often aboard an aircraft), and space-based systems. Ground-based and mobile detectors calculate the direction and severity of lightning from the current location using radio direction-finding techniques together with an analysis of the characteristic frequencies emitted by lightning. Ground-based systems use triangulation from multiple locations to determine distance, while mobile systems estimate distance using signal frequency and attenuation. Space-based lighting detectors, on artificial satellites, can locate range, bearing and intensities by direct observation. Ground-based lightning detector networks are used by meteorological services like the National Weather Service in United States and the Meteorological Service of Canada, and by other organizations like electrical utilities and forest fire prevention services. Each system used for lightning detection has its own limitations. These include: 1. A ground-based lightning network must be able to detect a strike with at least three antennas to locate it with an acceptable margin of error. This often leads to the rejection of cloud-to-cloud lightning, as one antenna might detect the position of the strike on the starting cloud and the other antenna the receiving one. As a result, ground-based networks have a tendency to underestimate the number of strikes, especially at the beginning of storms where cloud-to-cloud lightning is prevalent. 2. Since they use attenuation rather than triangulation, mobile detectors sometimes mistakenly indicate a weak lightning strike nearby as a strong one further away, or vice-versa. 3. Space-based lightning networks suffer from neither of these limitations, but the information provided by them is often several minutes old by the time it is widely available, making it of limited use for real-time applications such as air navigation. |
||
|
Personal lightning detectors
One type of lightning detector slowly increasing in popularity is the battery-operated personal lightning detector. Similar in size to a pager, personal lightning
Although personal lightning detectors do function well in regards to their ability to detect nearby lightning, they are quite basic in functionality when compared to professional lightning detectors. For example, they cannot tell where a lightning strike was located or from which direction the lightning is approaching, only that lightning is in the area. Also, since a personal lightning detector is triggered by EMPs, interference from other EMP-emitting devices (such as electronic equipment, appliances, nuclear weapons, fluorescent lights and even car engines) can sometimes result in either false alarms or missed strikes. This interference often has the additional effect of preventing personal lightning detectors from functioning properly while indoors. Despite these limitations, personal lightning detectors continue to increase in popularity among individuals and professionals. |
||
|
Aviation use
Large airliners are more likely to use weather radar than lightning detectors, since weather radar can detect smaller storms that also cause turbulence; however, modern avionics systems often include lightning detection as well, for additional safety. For smaller aircraft, especially in general aviation, there are two main brands of lightning detectors (often referred to as sferics, short for radio atmospherics): Stormscope, produced originally by Ryan (later B.F. Goodrich) and currently by L-3 Communications, and the Strikefinder, produced by Insight. Lightning detectors are inexpensive and lightweight, making them attractive to owners of light aircraft (particularly of single-engine aircraft, where the aircraft nose is not available for installation of a radome). |
||
|
Top of page
|
||
|
|
||
|
A lightning prediction system includes various methods and different apparatus for remotely sensing electrical activity and the potential for lightning occurrence. In the several variant systems and methods, means are provided for the automated prediction of lightning strikes in a set of different functional regions for different times in the future. The system utilizes measurements of many weather phenomena. The types of measurements that can be utilized in approximately the same geographical region as that for which the strike predictions are made. The systems utilizes a correlation network to relate these weather measurements to future lightning strikes. |
||
|
Description of lightning prediction system
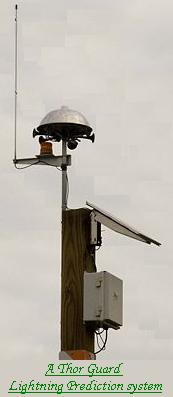
Various systems use different apparatus and methods to detect the electrical potential levels of electrical storms. Storms are illuminated by various means and the information returns are correlated. Various devices provide a system and method for predicting areas where lightning strikes are likely to occur by evaluating radar and temperature data. Radar volume data is analyzed to locate cloud tops that extend above a height corresponding to a temperature line of about 10 C. Areas where cloud tops extend above the height of the 10 C. line and that have a radar composite reflectivity greater than 30 dBZ are designated as probable lightning threat areas. Radar movement is tracked across at least two time periods, and a correlation algorithm predicts the future location of lightning threat areas at predetermined time periods (e.g., 10 minutes, 20 minutes, and 30 minutes) based on predicted radar values. A computer display shows the predicted location of the lightning threat areas for the future time periods. 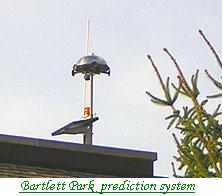
The method and apparatus remotely sense electrical activity and potential for lightning occurrence. The devices are particularly directed to the use of such a method to detect the electrical alignment of particles in upper levels of electrical storms. Storms are scanned by radar in one or more orthogonal polarizations and the co-polar and cross-polar returns are correlated coherently and incoherently. The correlation coefficient, or a function thereof, is examined to determine the degree of particle alignment, and therefore the degree of electrification and potential for lightning occurrence. The phase of the correlation computation, in coherent processing, also detects particle alignment, which can be incorporated in the predictive decision. Correlation and phase can be displayed, recorded or, utilized for a prediction or warning. The method used by such systems for detecting lightning as an electrical atmospheric disturbance and for providing an indication of the georaphic position of that disturbance includes the stationing of at least three receivers at known geographic locations in spaced relationship to each other. Signals are encoded at each of the receivers representative of the time of arrival of an electrical indication of an emission from the lightning strike, in relation to a common timing source. All of the encoded signals are transmitted to a central facility and thereafter processed for deriving the position of the lightning strike irrespective of whether the position of the lightning occurred within or outside the perimeter bounded by the three receivers. The system is synchronized with the U.S. Coast Guard LORAN navigation network, and includes various features which permit a more accurate analysis of lightning position. |
||
|
Top of page
|
||
|
|
||
|
Description - History
A weather radar is a type of radar used to locate precipitation, calculate its motion, estimate its type (rain,
snow, hail, etc.), and forecast its future position and intensity. Modern weather radars are mostly doppler radars, capable of
During World War II, military radar operators noticed noise in returned echoes due to weather elements like rain, snow, and sleet. Just after the war, military scientists returned to civilian life or continued in the Armed Forces and pursued their work in developing a use for those echoes. In the United States, David Atlas,[1] for the Air Force group at first, and later for MIT, developed the first operational weather radars. In Canada, J.S. Marshall and R.H. Douglas formed the "Stormy Weather Group[2]" in Montreal. Marshall and his doctoral student Walter Palmer are well known for their work on the drop size distribution in mid-latitude rain that led to understanding of the Z-R relation, which correlates a given radar reflectivity with the rate at which water is falling on the ground. In the United Kingdom, research continued to study the radar echo patterns and weather elements such as stratiform rain and convective clouds, and experiments were done to evaluate the potential of different wavelengths from 1 to 10 centimetres. In 1953, Donald Staggs, an electrical engineer working for the Illinois State Water Survey, made the first recorded radar observation of a "hook echo" associated with a tornadic thunderstorm. 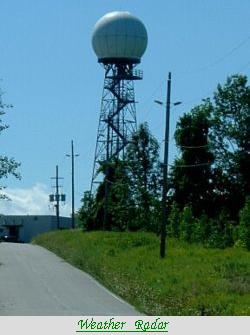
Between 1950 and 1980, reflectivity radars, which measure position and intensity of precipitation, were built by weather services around the world. The early meteorologists had to watch a cathode ray tube. During the 1970s, radars began to be standardized and organized into networks. The first devices to capture radar images were developed. The number of scanned angles was increased to get a three-dimensional view of the precipitation, so that horizontal cross-sections (CAPPI) and vertical ones could be performed. Studies of the organization of thunderstorms were then possible with the Alberta Hail Project in Canada and NSSL in the US in particular. NSSL, created in 1964, began experimentation on dual polarization signals and on Doppler effect uses. Between 1980 and 2000, weather radar networks became the norm in North America, Europe, Japan and other developed countries. Conventional radars were replaced by Doppler radars, which in addition to position and intensity of could track the relative velocity of the particles in the air. In the United States, a network consisting of 10 cm wavelength radars, called NEXRAD or WSR-88D (Weather Service Radar 1988 Doppler), was started in 1988. In Canada, Environment Canada constructed the King City station,[3] with a five centimeter research Doppler radar, by 1985;McGill University dopplerized its radar (J. S. Marshall Radar Observatory) in 1993. This led to a complete Canadian Doppler network[4] between 1998 and 2004. France and other European countries switched to Doppler network by the end of the 1990s to early 2000s. Meanwhile, rapid advances in computer technology led to algorithms to detect signs of severe weather and a plethora of "products" for media outlets and researchers. After 2000, research on dual polarization technology has moved into operational use, increasing the amount of information available on precipitation type (e.g. rain vs. snow). "Dual polarization" means that microwave radiation which is polarized both horizontally and vertically (with respect to the ground) is emitted. Wide-scale deployment is expected by the end of the decade in some countries such as the United States, France,[5] and Canada..
How weather radar works
Weather radars send directional pulses of microwave radiation, on the order of a microsecond long, using a cavity magnetron or klystron tube connected to a waveguide to a parabolic antenna. The wavelengths of 1 to 10 cm are approximately ten times the diameter of the droplets or ice particles of interest, because Rayleigh scattering occurs at these frequencies. This means that part of the energy of each pulse will bounce off these small particles, back in the direction of the radar station. 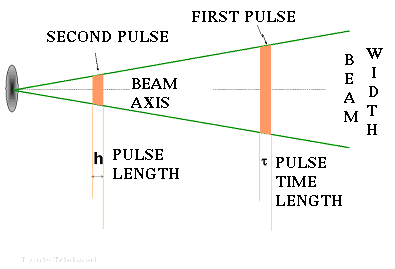
Shorter wavelengths are useful for smaller particles, but the signal is more quickly attenuated. Thus 10 cm (S-band) radar is preferred to but is more expensive than a 5 cm C-band system. 3 cm X-band radar is used only for very short distance purposes, and 1 cm Ka-band weather radar is used only for research on small-particle phenomena such as drizzle and fog. Radar pulses spread out as they move away from the radar station. This means that the region of air any given pulse is moving through is larger for areas farther away from the station, and smaller for nearby areas, decreasing resolution at far distances. At the end of a 150-200 km sounding range, the volume of air scanned by a single pulse might be on the order of a cubic kilometer. The volume of air that a given pulse takes up at any point in time may be approximately calculated by the formula Between each pulse, the radar station serves as a receiver and listens for return signals from particles in the air. The duration of the "listen" cycle is on the order of a millisecond, which is a thousand times longer than the pulse duration. The length of this phase is determined by the need for the microwave radiation (which travels at the speed of light) to propagate from the detector, to the weather target, and back again, a distance which could be several hundred kilometers. The horizontal distance from station to target is calculated simply from the amount of time that lapses from the initiation of the pulse to the detection of the return signal. (The time is converted into distance by multiplying by the speed of light). If pulses are emitted too frequently, the returns from one pulse will be confused with the returns from previous pulses, resulting in incorrect distance calculations. Assuming the Earth is round, with knowledge of the variation of the index of refraction through air and the distance to the target, one can
calculate the height above ground of the target.
How to read reflectivity on a radar display
Radar returns are usually described by colour or level. The colours in a radar image normally range from blue or green for weak returns, to red or magenta for very strong returns. The numbers in a verbal report increase with the severity of the returns. For example, the U.S. National Doppler Radar sites use the following scale for different levels of reflectivity: 1. Magenta: 65 dBZ (extremely heavy precipitation).
Strong returns (red or magenta) may indicate not only heavy rain but also thunderstorms, hail, strong winds, or tornadoes, but they need to be interpreted carefully, for reasons described later in this article. When describing weather radar returns, pilots, dispatchers, and air traffic controllers will typically refer to three return levels: Level 1 corresponds to a green radar return, indicating usually light precipitation and little to no turbulence, leading to a possibility of
reduced visibility.
Aircraft will try to avoid level 2 returns when possible, and will always avoid level 3 unless they are specially-designed research aircraft. In the sky there is more than rain and snow. Other objects can be misinterpreted as rain by a weather radar. The main ones are: 1. Birds, especially in period of migration.
Each of them has their own characteristics that make possible to distinguish them to the trained eye but they may fool a layman. It is possible to eliminate some of them with post-treatment of data using reflectivity, Doppler and polarization data.
Main types of radar outputs
All data from radar scans are displayed according to the need of the users. Different outputs have been developed through time to reach this. Here is a list of common and specialized outputs available. Plan position indicator: Since data are obtained one angle at a time, the first way of displaying them as been the Plan Position Indicator (PPI) which is only the layout of radar return on a two dimensional image. One has to remember that the data coming from different distances to the radar are at different heights above ground. 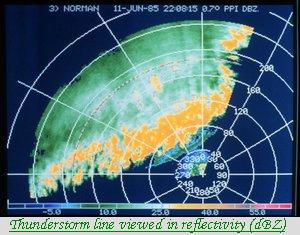
This is very important as a high rain rate seen near the radar is relatively close to what reach the ground but what is seen from 160 km (100 miles) away is about 1.5 km above ground and could be far different from the amount reaching the surface. It is thus difficult to compare weather echoes at different distance from the radar. PPIs are afflicted with ground echoes near the radar as a supplemental problem. These can be misinterpreted as real echoes. So other products and further treatments of data have been developed to supplement its shortcomings. USAGE: Reflectivity, Doppler and polarimetric data can use PPI. In the case of Doppler data, two points of view are possible: relative to the surface or the storm. When looking at the general motion of the rain to extract wind at different altitudes, it is better to use data relative to the radar. But when looking for rotation or wind shear under a thunderstorm, it is better to use the storm relative images that subtract the general motion of precipitation leaving the user to view the air motion as if he would be sitting on the cloud Constant Altitude Plan Position Indicator:To avoid some of the problems on PPIs, the CAPPI or Constant Altitude Plan Position Indicator has been developed by researchers in Canada. It is basically a horizontal cross-section through radar data. This way, one can compare precipitation on an equal footing at difference distance from the radar and avoid ground echoes. Although data are taken at a certain height above ground, a relation can be inferred between ground stations reports and the radar data. CAPPIs call for a large number of angles from near the horizontal to near the vertical of the radar in order to have a cut that is as close as possible at all distance to the height needed. But even then, after a certain distance, there isn’t any angle available and the CAPPI becomes the PPI of the lowest angle. The zigzag line on the angles diagram above shows the data used to produce a 1.5 and 4 km height CAPPIs. Notice that the section after 120 km is using the same data. USAGE: Mostly for reflectivity data. McGill University is producing Doppler CAPPIs but the nature of velocity make the output a bit noisy as velocities can change rapidly in direction with height contrary to a relatively smooth pattern in reflectivity. Vertical composite: Another solution to the PPI problems is to produce images of the maximum reflectivity in a layer above ground. This solution is usually taken when the number of angles available is small or variable. The American National Weather Service is using such Composite as their scanning scheme can vary from 4 to 14 angles, according to their need, which would make very coarse CAPPIs. The Composite make sure that no strong echo is missed in the layer and a treatment using Doppler velocities eliminate the ground echoes. 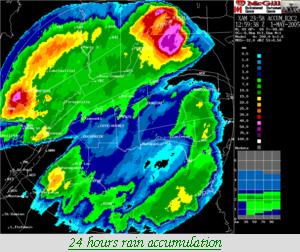
Accumulations: One of the main use of radar is to be able to assess the amount of precipitations fallen over large basins for hydrological purpose. For instance, river flood control, sewer management and dam construction are all areas where planners want accumulation data. It ideally completes surface stations data which they can use for calibration. To produce radar accumulations, we have to estimate the rain rate over a point by the average value over that point between one PPI, or CAPPI, and the next; then multiply by the time between those images. If one wants for a longer period of time, one has to add up all the accumulations from images during that time. Echotops: Aviation is a heavy user of radar data. One map particularly important in this field is the Echotops for flight planning and avoidance of dangerous weather. Most country weather radars are scanning enough angles to have a 3D set of data over the area of coverage. It is relatively easy to estimate the maximum altitude at which precipitation is found within the volume. However, those are not the tops of clouds as they extended to higher altitudes than the precipitation. Vertical cross sections: To know the vertical structure of clouds, in particular thunderstorms or the level of the melting layer, a vertical cross sections product of the radar data is available to meteorologist.
Lightning detectors vs. weather radar
Lightning detectors and weather radar are complementary to detect storms. Lightning detectors indicate electrical activity, while weather radar indicates precipitation. Both phenomena are associated with thunderstorms and can help indicate storm strength. 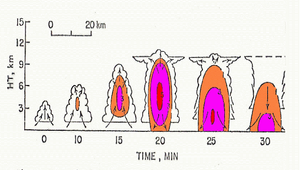
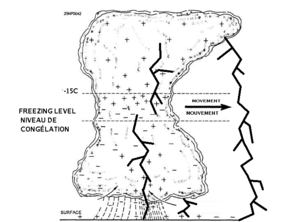
The image on the left shows the life cycle of a thunderstorm: Air is moving upward due to instability.
The cloud must develop to a certain vertical extent before lightning is produced, so generally weather radar will indicate a developing storm before a lightning detector does. It is not always clear from early returns if a shower cloud will develop into a thunderstorm, and weather radar also sometimes suffers from a masking effect by attenuation, where precipitation close to the radar can hide (perhaps more intense) precipitation further away. Lightning detectors do not suffer from a masking effect and can provide confirmation when a shower cloud has evolved into a thunderstorm. Lightning may be also located outside the precipitation recorded by radar. The second image shows that this happens when strikes originate in the anvil of the thundercloud (top part blown ahead of the cumulonimbus cloud by upper winds) or on the outside edge of the rain shaft. In both cases, there is still an area of radar echoes somewhere nearby. |
||
|
Top of page
|
||
|
Recommended screen resolution: 1024x768, color quality: 32 bit and IE 5.x or higher Never base important decisions on this weather information Not to be used for protection of life and property!! KIFISSIA meteo Copyright © 2006 - Ioannis P. Fragos , All rights reserved
|

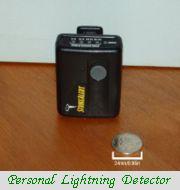 detectors are popular among golfers, campers, law enforcement, sports officials and other persons who work or recreate outdoors. Personal lightning detectors function by detecting the
electromagnetic pulse emitted by a lightning strike. By measuring the strength of the detected EMP, the device can then estimate how far away the detected strike was. When exposed to multiple
detected strikes, some personal lightning detectors can even calculate and extrapolate the direction of the storm's movement relative to its position (approaching, departing or stationary).
detectors are popular among golfers, campers, law enforcement, sports officials and other persons who work or recreate outdoors. Personal lightning detectors function by detecting the
electromagnetic pulse emitted by a lightning strike. By measuring the strength of the detected EMP, the device can then estimate how far away the detected strike was. When exposed to multiple
detected strikes, some personal lightning detectors can even calculate and extrapolate the direction of the storm's movement relative to its position (approaching, departing or stationary).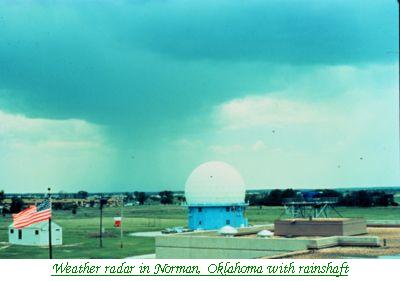 detecting the motion of rain droplets in addition to intensity of the precipitation. Both types of data can be analyzed to determine the structure of storms
and their potential to cause severe weather.
detecting the motion of rain droplets in addition to intensity of the precipitation. Both types of data can be analyzed to determine the structure of storms
and their potential to cause severe weather.